Identifying A Weather Front For Firefighters: Part 2
In part 1 we looked at understanding weather data to help identify a frontal boundary. In part 2 we will conclude by examining wind speed and direction as part of our understanding the front, its movements and its expected behavior.Lets begin by looking at a very important weather symbol.
Wind Barb Symbols
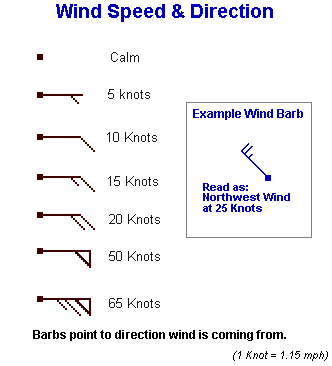
How do we read wind barbs?
Wind barbs depict speed by the tick marks (or pennants) on the staff and the direction is indicated by the orientation of the main staff. Think of a bow and arrow to understand in which direction the wind is moving. A northwest wind means that the wind is coming FROM the Northwest.
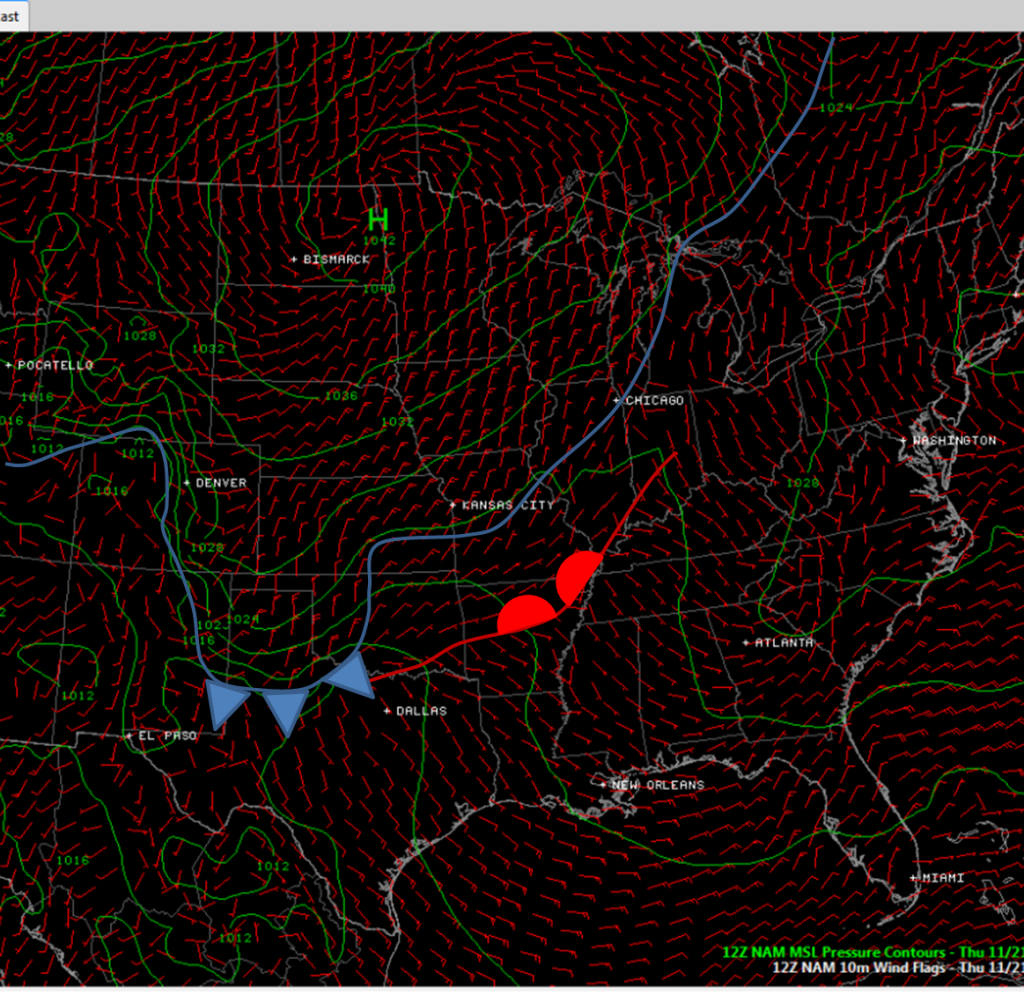
For all practical purposes, you can define that wind shift as the front. After all, the wind shift is what is important to fire operations, not the pressure trough per se.
I have drawn a blue line (with a few select wind barbs (the rest omitted for clarity) to depict the cold front boundary. There is also a warm front indicated from north Texas to Little Rock to Memphis. This is why that valley seems to have a pair of subtle “canyons” in the area from Indianapolis to north of St. Louis. The sharper the canyons, the more vigorous things get!
Remember that both warm fronts and cold fronts dwell in pressure troughs and this can bring some confusion at first. In later articles, when we talk about severe weather setups, one will see that the warm front/cold front interaction area becomes very important. This is why I bring it up at this point in the discussions.
I encourage you to look at pressure/wind maps as practice over the next week so that you can start to become familiar with it. Get yourself setup with a free account at https://simuawips.com . Then launch the SimuAWIPS console, and select Analysis>Surface MSLP and Winds. MSLP is an acronym for Mean Sea Level Pressure.
By viewing objective analyses such as this, and furthermore watching the progression in time, you can see where the bulk of the cold air is going. In this example, northwest Texas is the target. Just notice how much well-developed the frontal push is in NW Texas vs. say Illinois. After all, usually where the “push” is the strongest, so is the weather.
There are even more surface boundaries and fronts on the map above. Can you find them?
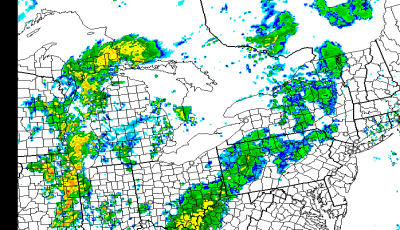
As a final note, be very wary of weather web sites with pretty weather pictures.
The steps in making pretty pictures mask nuances that may be VERY important, such as the warm front analyzed above. You are a professional public safety official and weather is important to your own safety. Use the very best data you can. Optimally, the best option is using the same sorts of data which the National Weather Service (or your local governmental meteorological agency) uses if you can get it.

