Firefighter Operations and Weather Charts
Thus far, we have talked about the basics of weather. Temperature, moisture, pressure, fronts, and so on, mostly as discrete elements.
As hinted before, there is virtually nothing that is absolute in meteorology, just as you see in firefighting operations. Just because the humidity reaches a certain value does not mean you’ll have a high end wildfire day. It is a combination of factors.
In firefighting, it’s often wind and humidity (relative moisture) and longer term components such as fuel moisture. For severe weather: wind, temperature, and moisture are all factors.
But it’s not about what happens at a single point on the earth’s surface. Rather, it is a distribution of many variables spread geographically and in the vertical. Before we can better understand the weather we experience at one location, we must understand what is going on around us.
Maps are a way to do just that.
Maps and Charting
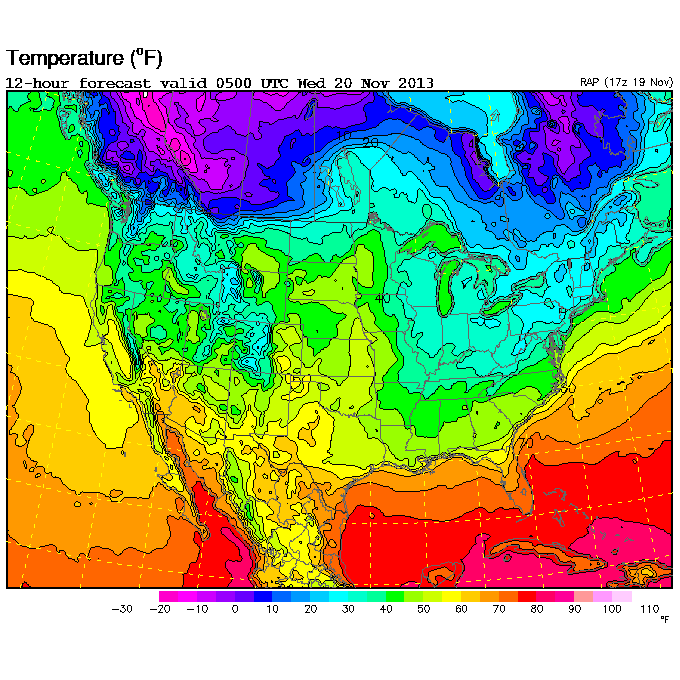
So, let’s start with a fairly easy to understand map with shaded colors depicting temperature. Most people can grasp this type of map quite easily but not all maps are shaded as such.
In the following map, we can see that it’s cooler across the Great Lakes region (though warmer over the lake itself) and warmer temperatures are present across the Central USA with bitter cold present across Alberta and British Columbia.
But, in order to advance in our understanding of weather, we need to be able to conceptualize things in the absence of color shading as many meteorological maps are not shaded.
Similar to firefighting operations we examine issues as a whole, or in color, but also in the black and white. We must “dissemble” what is given us and extract the needed info to make an informed decision. Let me explain further.
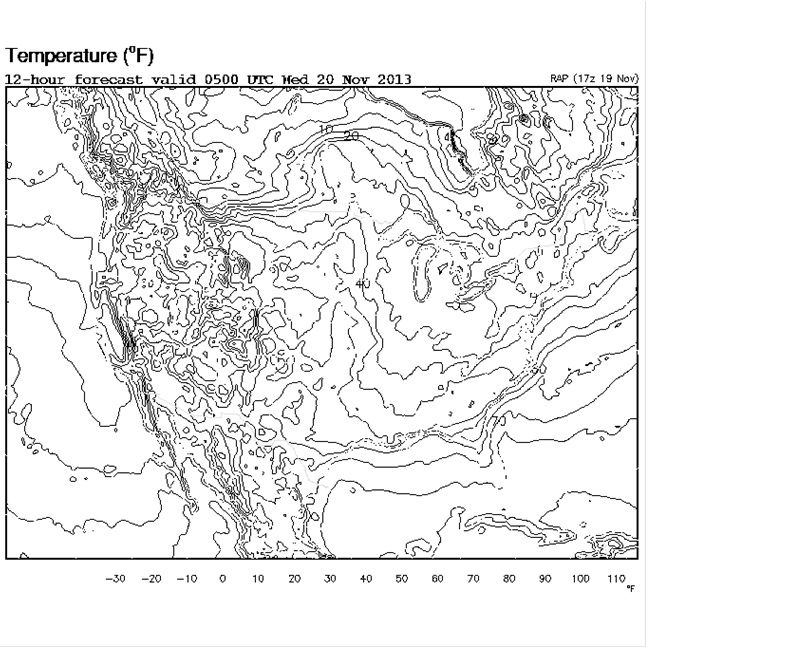
We must be able to find patterns in the lines, and so forth. When we remove the shading, we are left with something like this.
How do we read this?
We must conceptualize the contours in the data and think of the map as though it were a topographic map showing terrain except now, the elevation becomes the meteorological parameter that we’re looking for.
In essence, there is a “ridge” of warmer temperatures across the Central USA and a bit of a broad “valley” of temperatures in the eastern part of the country. Furthermore, the farther south one goes, the warmer it gets. This is easiest seen in the Gulf of Mexico.
Next time, we’ll put this to use as we learn to identify front lines, an important item as firefighters you will need to know. Until then keep watching the sky and stay safe.

