Weather and Firefighters – When There Is Too Much Pressure!
When we tune into local media, we often hear the term “air pressure.” As we’ll get to in later discussions, pressure is an important ingredient into weather and forecasting. It has implications with the depth and intensity of weather systems as well as the thermal vertical profile of the atmosphere.
With increasing height, air pressure decreases. For example, at 18,000’ above sea level, the air pressure is roughly half of that which exists at sea level. This raw pressure is often referred to as station pressure, but is rarely communicated to the public.
Normally in local media or the NOAA weather radio hourly roundup, one usually hears pressure referred to a number like 29.92” inches or 30.20” inches and is typically the local altimeter setting. This is the value most critical for aviation interests. With an altimeter setting, the raw pressure reading is adjusted for altitude and other factors.
However, for weather forecasting, of more interest is a pressure adapted to a reference. This is referred to as Mean Sea Level Pressure (MSLP.) With MSLP, the equivalent sea level pressure is computed by taking the station pressure and applying a complex set of formulae which includes the surveyed station height, temperature, and climatological influences, such as average moisture are applied.
As we’ll see later, the MSLP is what is displayed on surface plots. With the incorporation of the metric system into the international meteorological community, the term millibars [mB] (also known as hectopascals [hPA) are used by meteorologist. In general, an average pressure around the world is often somewhere in the vicinity of 29.92” of Mercury (inHg) or 1013.3 mB/hPA. Just as Fahrenheit and Celsius are different scales to measure the temperature, so too are mB and inHG.
For firefighting operations, more important that the absolute value of pressure is the change in pressure over time. Larger scale changes (more than about 0.06” or 2mB per hour) are often operationally significant. These may exist in the vicinity of strong fronts, thunderstorms, or other phenomena.
If the pressure is falling, it’s likely that the weather threat is increasing. If rising, more often than not, it is decreasing. However, be cautioned that even though pressure may be rising quickly, non-precipitation threats, such as high winds, are still a possibility. After all, it is the changes of surface pressure that give us our winds.
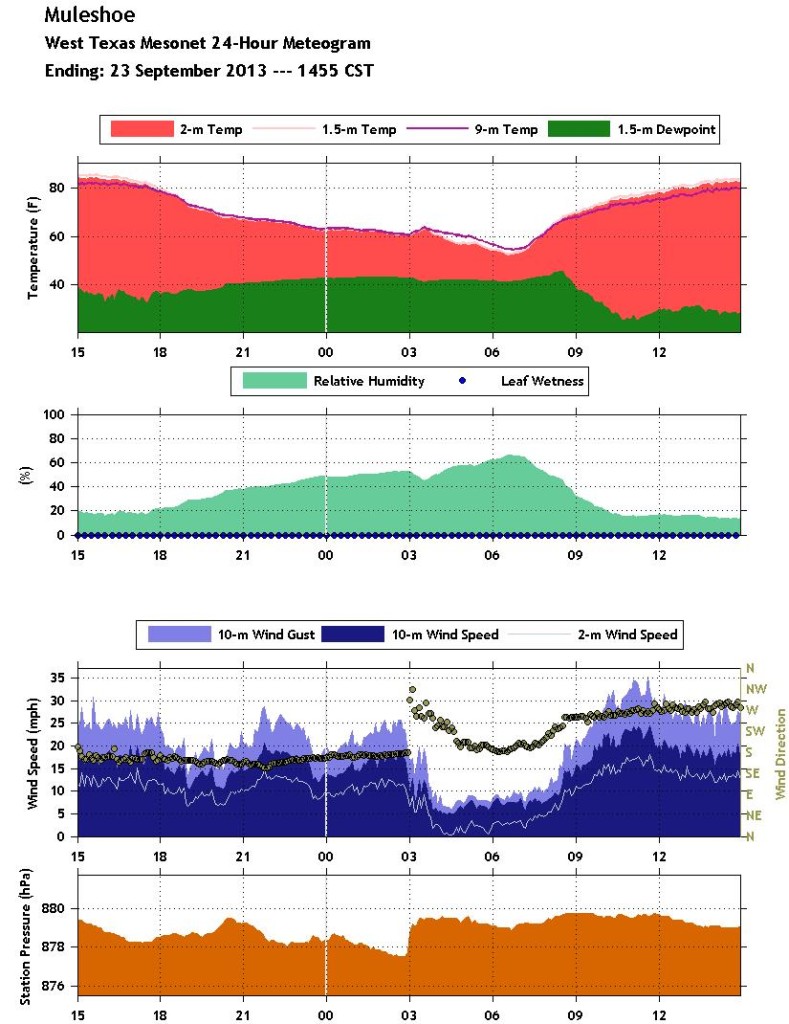
Let’s take this just a step further and examine the effects of a weak cold front on the Muleshoe, TX West Texas Mesonet station. The following graphic is called a meteogram and depicts temperature, dewpoint, relative humidity, wind speed and direction, and the station pressure over a 24 hour period.
The time (in UTC) is depicted at the bottom of each sub-graph. Note what happened at 03Z. While a significant temperature/dewpoint/RH change was not noted, examine the wind direction and speed along with the pressure.
At 03Z (about 9pm CDT), the wind abruptly changed from southerly to northwesterly along with a sharp drop in wind speed. At this same time, the station pressure jumped almost 2mB within just a few minutes. This was a weak cold front passage and only evident in the wind and pressure field.
Take some time to dig into the details of the chart. Next time on our tour of weather for the firefighter we will discuss the water cycle and how it influences operations. Knowing where our water comes from and how it really can change the outside temperatures is vital to our fire operations.


